STUDENTS / FAMILIES / COMMUNITY OUTCOMES
Education & Human Services
Bring service access, demand, capacity, facilities and outcomes together while protecting privacy and preserving human judgment.
Design my dashboard →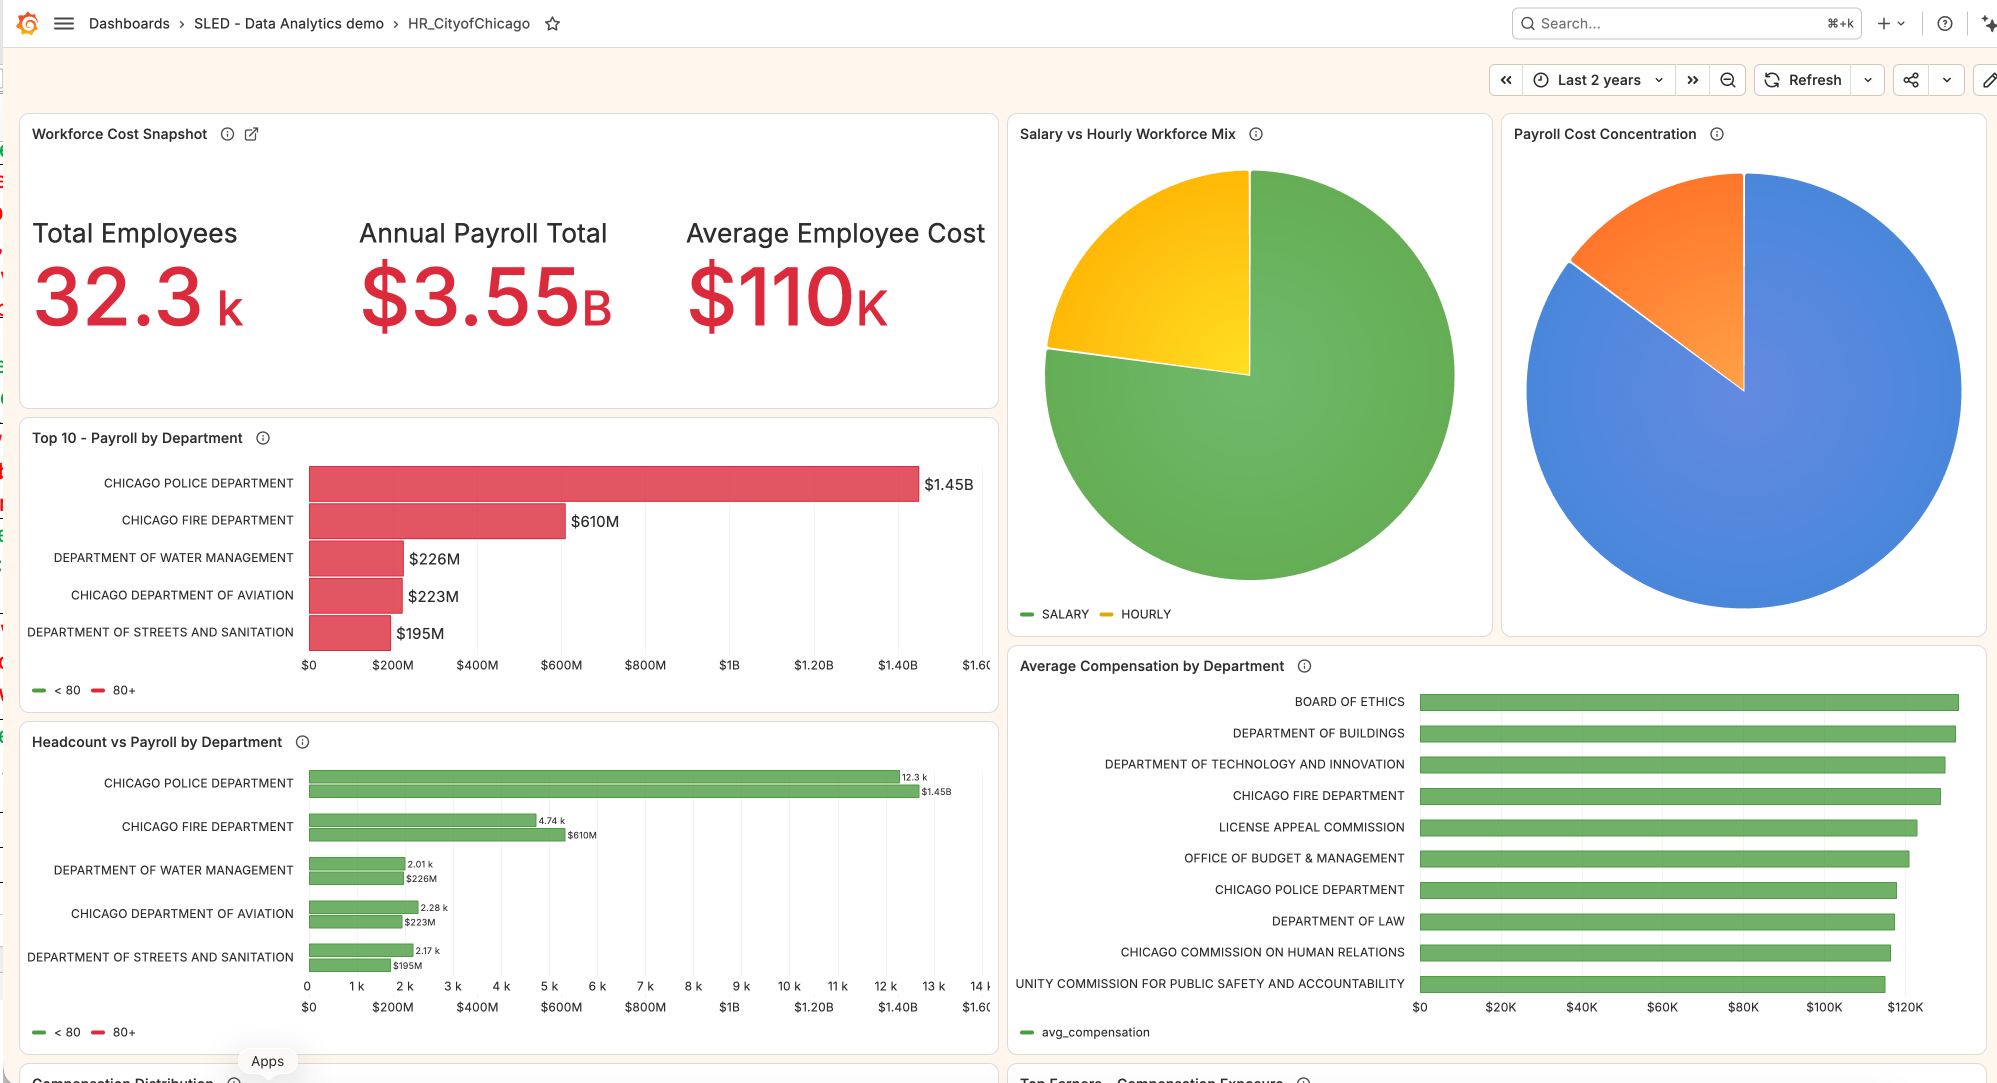
Bring service access, demand, capacity, facilities and outcomes together while protecting privacy and preserving human judgment.
Design my dashboard →Demand, access, quality, capacity, equity and program performance.
Caseload, timeliness, participation, milestones, exceptions and provider capacity.
Action queues, risk signals, workload balance and follow up status.
Cohorts, geography, program comparison and longitudinal patterns.
Dashboards combine current conditions, historical patterns, exceptions and context so teams understand both what happened and what requires action.
Bring us a question, a report, or a source system. SPS will map the signals and shape a measurable proof of value.