ASSETS / FIELD SERVICE / INFRASTRUCTURE
Utilities & Public Works
Turn asset, work order, outage, sensor, fleet and constituent data into a common operating picture.
Design my dashboard →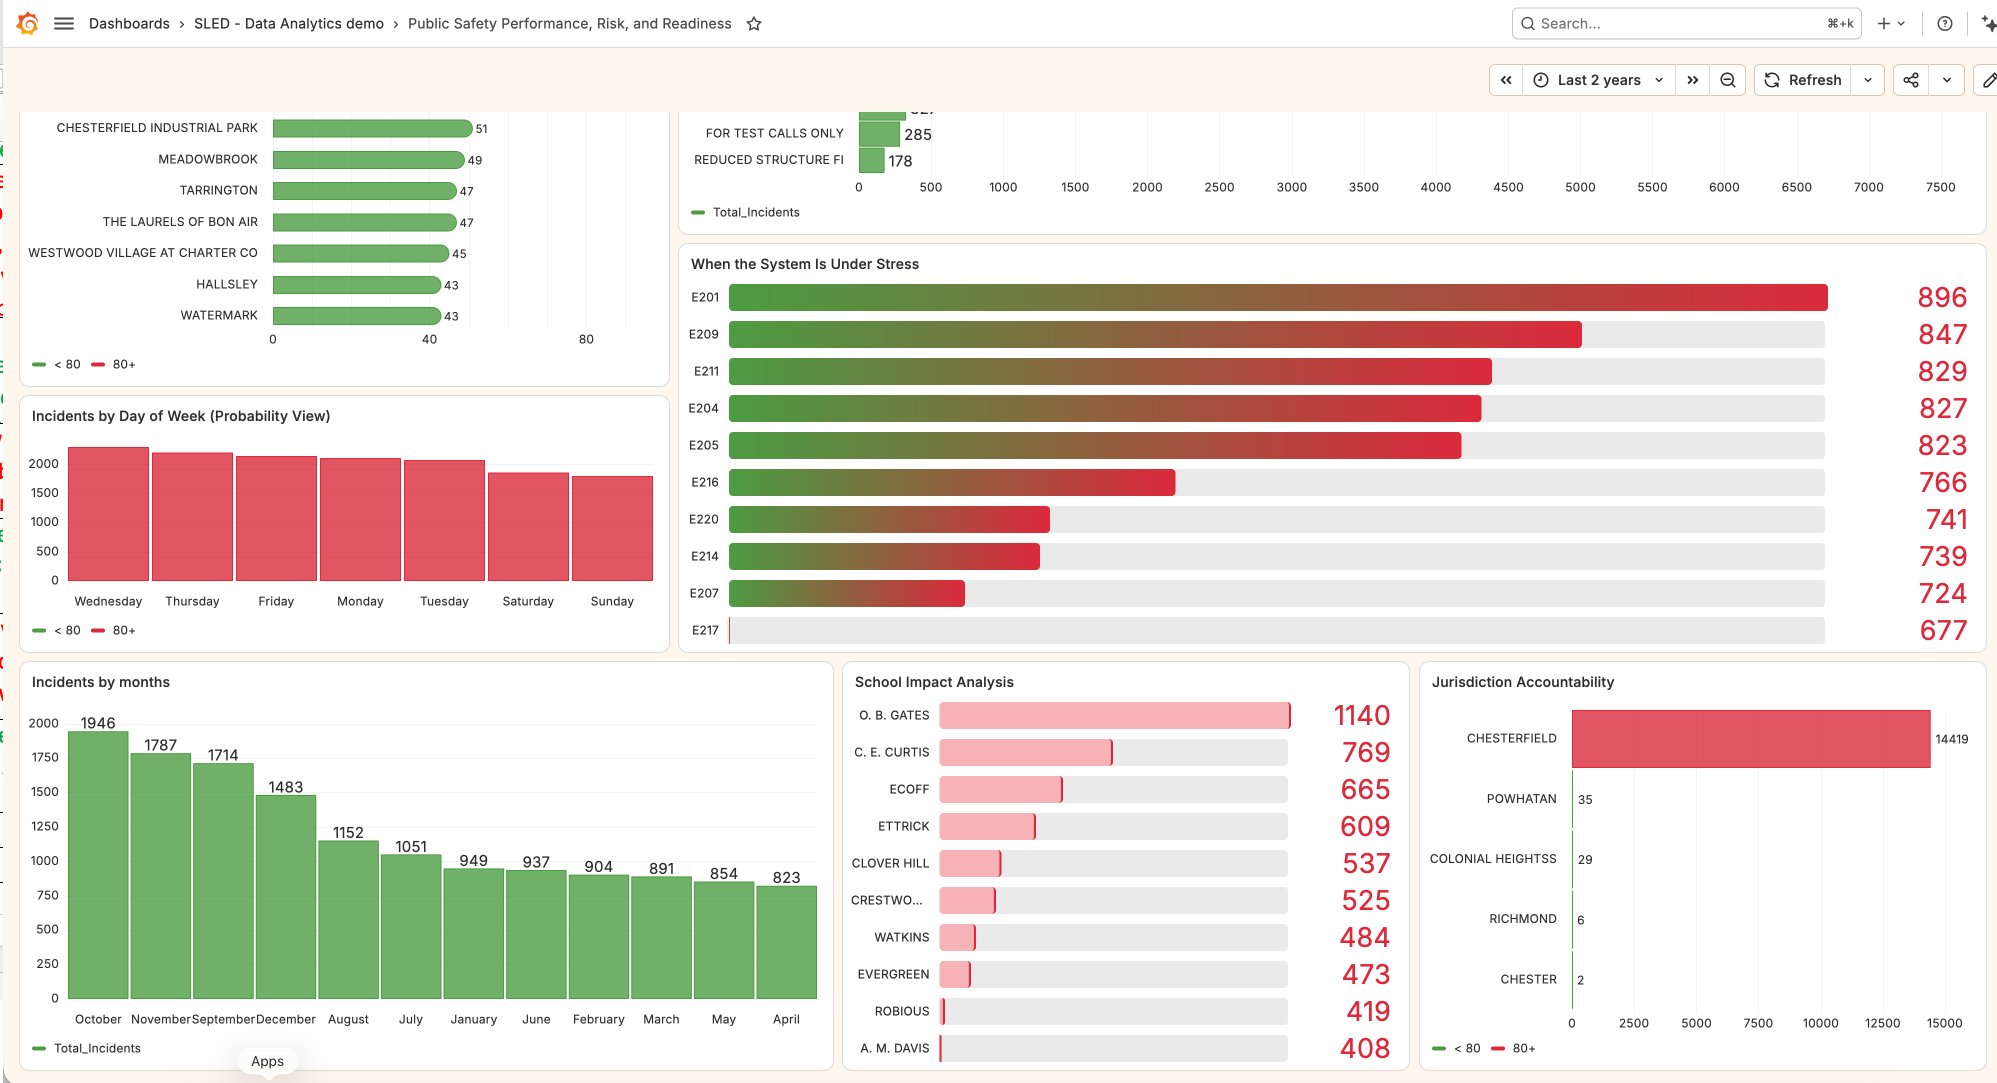
Turn asset, work order, outage, sensor, fleet and constituent data into a common operating picture.
Design my dashboard →Reliability, backlog, investment risk, geographic impact and service equity.
Outages, alarms, asset health, capacity, weather and field resource status.
Crew assignment, work order age, repeat visits, parts and safety conditions.
Failure patterns, condition, maintenance history and capital prioritization.
Dashboards combine current conditions, historical patterns, exceptions and context so teams understand both what happened and what requires action.
Bring us a question, a report, or a source system. SPS will map the signals and shape a measurable proof of value.